Intuitive, powerful, graphical analysis environment: Spotfire's interactive, visual capabilities for data analysis empower individuals to easily see trends, patterns, outliers and unanticipated relationships in data with unprecedented speed and adaptability. It features multiple visualizations per page, dynamically linked with user-customizable drill-down and marking, and innovative graphical filtering.
Guided Analysis: embedded templates provide pre-formatted interactive graphical reports that help users get started quickly. These templates can be extended and customized easily so that any data investigator, not just power users, can get to root causes quickly and confidently.
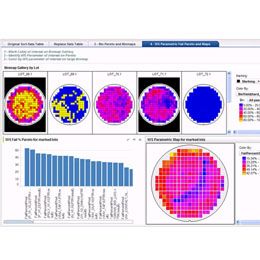
Sophisticated semiconductor content: Spotfire users benefit from dataPOWER®'s rich semiconductor-specific analysis, such as full-featured bin maps, wafer maps, zonal analysis and equipment commonality analysis.
Fully integrated dataPOWER database: dataPOWER® VSF is fully integrated with the dataPOWER database to capture, organize, consolidate and align data from all fabrication and testing processes. This enables quick and easy retrievals, correlation between data sources, and drill-down to tool data. The database empowers your engineers to spend their time interpreting results and lifts the burden of finding, merging, overlaying, summarizing and augmenting diverse data from multiple sources.
Multiple Data Access Options: data can be retrieved and merged from the dataPOWER® database, client databases and files.
Automated, wide access to yield reports: dataPOWER® VSF's web-based reporting tool, dpMonitor, automatically pushes reports out to all engineers and managers involved in yield management. Report generation and distribution can be scheduled or event triggered, with comprehensive HTML reports delivered via email throughout the organization.